Outliers
At the experiment level, I-SPI calculates three types of outliers for your samples. The three outliers calculated are: the Hampel outlier, bagplot outlier, and kernel density estimate outlier for a set of two time points. An interactive visualization is provided allowing you to identify specific samples that are outliers and view information about the kernel density level, sample identifying information, and samples that are missing at any of the timepoints.
Subgroup Detection
I-SPI is able to determine subgroups of individuals, characterizing their immunological response with finite mixture models using two timepoints. The magnitude and direction of response is characterized using k-means clustering. This finite mixture model and k-means clustering is displayed in an interactive plot of the response over time for each antigen separated by study arm. Additionally, another plot shows how subjects cluster into subpopulations with similar structure across different antigens.
Study-Wide Summarization
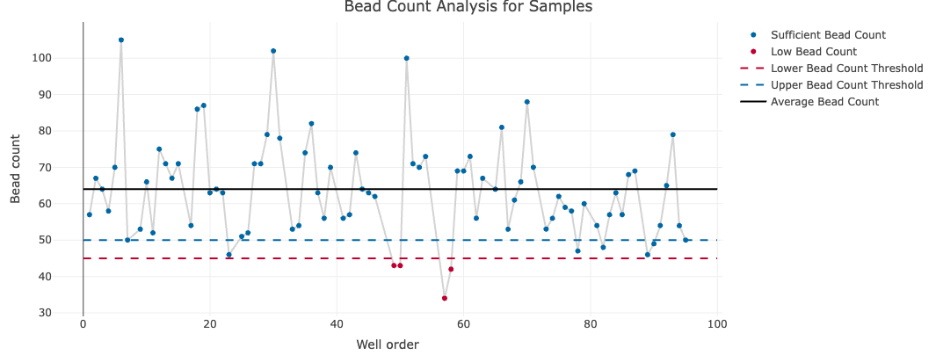
I-SPI provides you with figures and tables to summarize both the data structure of the data you upload and the results of the quality control data processing. The number of blanks, controls, and standards are shown on each plate for each analyte in the study. Similarly, the number of samples by time period are shown. Arm balance on plates within analytes is also presented visually, ensuring that the balance of your samples by arms is what you expected. Based on your choice of bead count threshold, a plot arranged by antigen and plate indicates the number of samples with a low bead count or a high number of aggregate beads. Sample quality can also be viewed from the study level, summarizing the proportion of samples on each plate by antigen and by sample quality derived from the robust standard curves for the analyte of interest.